
ResearchFinal drive by class
What's a normal final drive for your RC?
Thinking about a bigger pinion? It helps to know where your car’s gearing sits next to similar cars. We lined up the stock gearing of about 200 cars and trucks in our catalog by class, and found a simpler way to compare them.
Published . Research figures are from September 25, 2026.
Final drive in one line
The final drive ratio tells you how many times the motor turns for each turn of the wheels. It’s the spur divided by the pinion, multiplied by the reduction inside the transmission and axles, which makers call the internal ratio.
How a Traxxas Slash 4X4 BL-2s gets to 11.84:1
- 13TPinion on the motor
- 54TSpur: 54 ÷ 13 = 4.15
- × 2.85Transmission and diffs
- 11.84:1Motor turns per wheel turn
A higher number means more turns of the motor for each turn of the wheels: more acceleration and less top speed. A lower number is the reverse. On its own, though, the number doesn’t tell you as much as it seems to.
Typical final drive by class
Here’s where stock gearing sits for the most common classes and scales. Each box covers the middle half of the class, and the white tick is the median, the car in the middle of the list.
Stock final drive by class
Show the numbers
| Class | Median | Middle half | Lowest to highest |
|---|---|---|---|
| Touring car 1/10 | 6.5:1 | 5.7 to 7.9 | 5.0 to 9.4 |
| Street and GT 1/8 | 8.3:1 | 8.2 to 10.0 | 7.5 to 10.4 |
| Buggy 1/10 | 10.6:1 | 10.3 to 11.5 | 8.8 to 12.6 |
| Short course truck 1/10 | 11.5:1 | 10.2 to 12.1 | 7.7 to 15.3 |
| Buggy 1/8 | 11.7:1 | 10.2 to 12.0 | 9.3 to 18.5 |
| Monster truck 1/10 | 12.8:1 | 11.0 to 15.2 | 8.4 to 20.0 |
| Monster truck 1/8 | 13.4:1 | 12.9 to 15.1 | 11.7 to 21.8 |
| Truggy 1/8 | 14.8:1 | 14.4 to 16.5 | 13.2 to 17.0 |
- Touring cars sit lowest, with a median around 6.5:1.
- Buggies (1/10 and 1/8) and short course trucks cluster between roughly 10:1 and 12:1.
- Monster trucks spread the widest. The 1/10 middle half runs from 11.0:1 to 15.2:1.
- 1/8 truggies sit highest of the fast classes, around 14.8:1.
Crawlers are in a different world. Their median is around 38.0:1, and most sit between 31.9:1 and 44.6:1, because they trade almost all their speed for control at walking pace.
Stock final drive, 1/10 crawlers
Show the numbers
| Class | Median | Middle half | Lowest to highest |
|---|---|---|---|
| Crawler 1/10 | 38.0:1 | 31.9 to 44.6 | 20.3 to 73.4 |
Why a touring car and a monster truck gear alike
A touring car runs about 6.5:1 and a 1/10 monster truck about 12.8:1. That looks like very different gearing, until you look at the tires. The monster truck’s tires are about 128mm tall, twice the touring car’s 64mm, so each turn of its wheels covers twice the ground.
The figure that puts them side by side is rollout: how far the car moves for one turn of the motor. It’s the tire’s circumference divided by the final drive. Both cars come out close to 30mm.
Rollout by class: how far the car moves per motor turn
Show the numbers
| Class | Median | Middle half | Typical tire |
|---|---|---|---|
| Crawler 1/10 | 9.4mm | 8.6 to 10.0mm | 108mm |
| Short course truck 1/10 | 29.1mm | 25.2 to 34.1mm | 109mm |
| Touring car 1/10 | 30.7mm | 30.7 to 31.3mm | 64mm |
| Buggy 1/8 | 31.2mm | 30.9 to 36.0mm | 117mm |
| Monster truck 1/10 | 32.6mm | 26.7 to 37.1mm | 128mm |
| Street and GT 1/8 | 34.1mm | 26.8 to 35.9mm | 85mm |
| Monster truck 1/8 | 39.5mm | 35.8 to 40.3mm | 169mm |
Most classes land between about 29mm and 34mm per motor turn at the median. 1/8 monster trucks run taller, around 40mm, and crawlers are down near 9mm. So when you compare your car with another, or try bigger tires, compare rollout rather than the final drive alone. The final drive ratio and rollout calculator works it out from your pinion, spur and tire size.
Cars near the middle of their class
If you want a reference point, these are stock setups close to the median for their class. Each links to its spec sheet with the full gearing and sources.
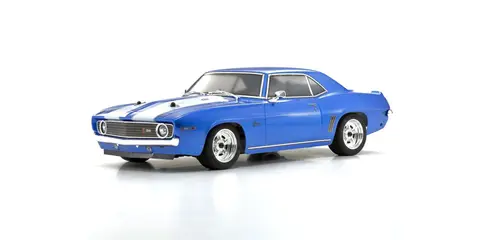 Kyosho Fazer Mk2 FZ026.54:1 · 31mm per turnPhoto: Kyosho
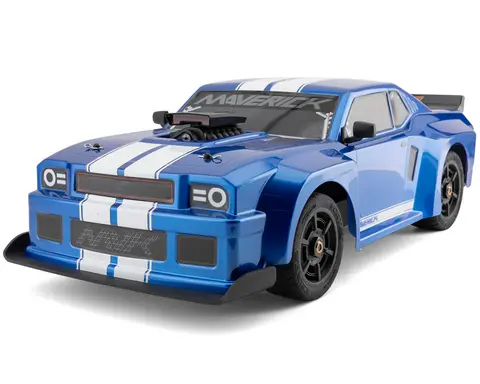 Maverick QuantumR Flux Muscle Car8.33:1 · 36mm per turnPhoto: AMain Hobbies
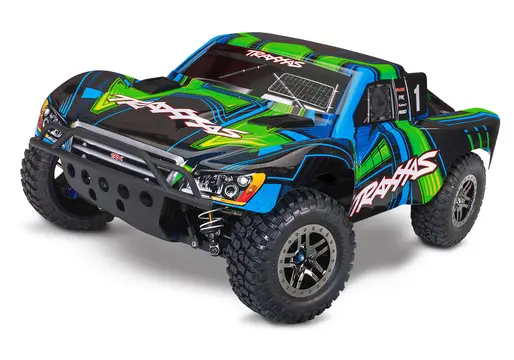 Traxxas Slash 4X4 VXL Ultimate11.82:1 · 29mm per turnPhoto: Traxxas
 Kyosho Inferno MP10 Readyset11.70:1 · 31mm per turnPhoto: Kyosho
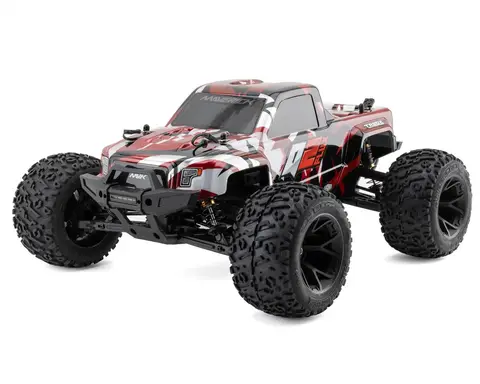 Maverick Quantum2 MT Flux13.05:1 · 29mm per turnPhoto: AMain Hobbies
 Arrma Kraton 6S BLX V613.44:1 · 40mm per turnPhoto: Horizon Hobby
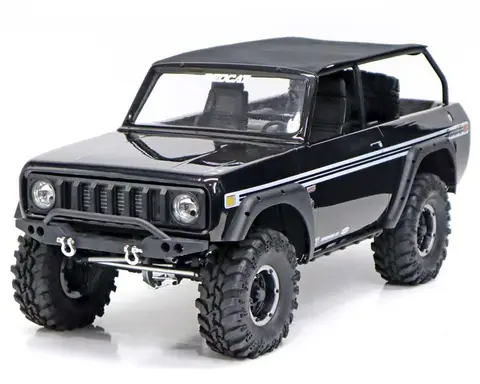 Redcat Gen8 Scout II AXE38.04:1 · 9mm per turnPhoto: HobbyTown
What one pinion tooth changes
Top speed moves in step with the pinion. One extra tooth raises the theoretical top speed by one tooth’s share of the pinion, so the same change matters more on a small pinion than a big one.
Top speed gained by adding one pinion tooth
Show the numbers
| Pinion | One tooth more | Speed change |
|---|---|---|
| 12T | 13T | +8.3% |
| 14T | 15T | +7.1% |
| 16T | 17T | +6.3% |
| 18T | 19T | +5.6% |
| 20T | 21T | +5.0% |
| 24T | 25T | +4.2% |
More speed also means more load. The motor works harder at every throttle position, and it runs hotter. On a short course truck geared like the Slash above, going from 13T to 15T is about 15% more theoretical speed, which is a big step for a stock motor and speed control.
Before you change the pinion
- Find your stock figures. The spec sheet for your car in our vehicle catalog lists the stock pinion, spur and final drive with links to the maker’s documents.
- Compare rollout, not just the ratio. If your tires are bigger or smaller than stock, the same pinion gives a different result. The tire size and gearing calculator shows the pinion that keeps your rollout the same.
- Change one or two teeth at a time. The target pinion calculator works backwards from a speed you choose.
- Check the temperature after a few minutes. If the motor is too hot to hold a finger on for a few seconds, go back down a tooth.
- Match the pitch and set the mesh. A new pinion has to suit your spur’s pitch and your motor shaft. Our guide to checking your gearing covers what to look for.
About this review
This article describes the catalog as it stood on September 25, 2026. We took the stock final drive from each spec sheet, grouped vehicles by class and scale, and left out groups too small to say much. Rollout uses the maker’s published tire diameter; where a maker doesn’t publish one, that car is left out of the rollout chart. Our methodology page covers the formulas.
The classes come from each vehicle’s spec sheet, and stadium trucks, rally cars and a few others aren’t grouped yet, so they’re not shown here. If you spot a figure that looks wrong, send the model name and a source link to hello@rctunelab.com so we can check it.